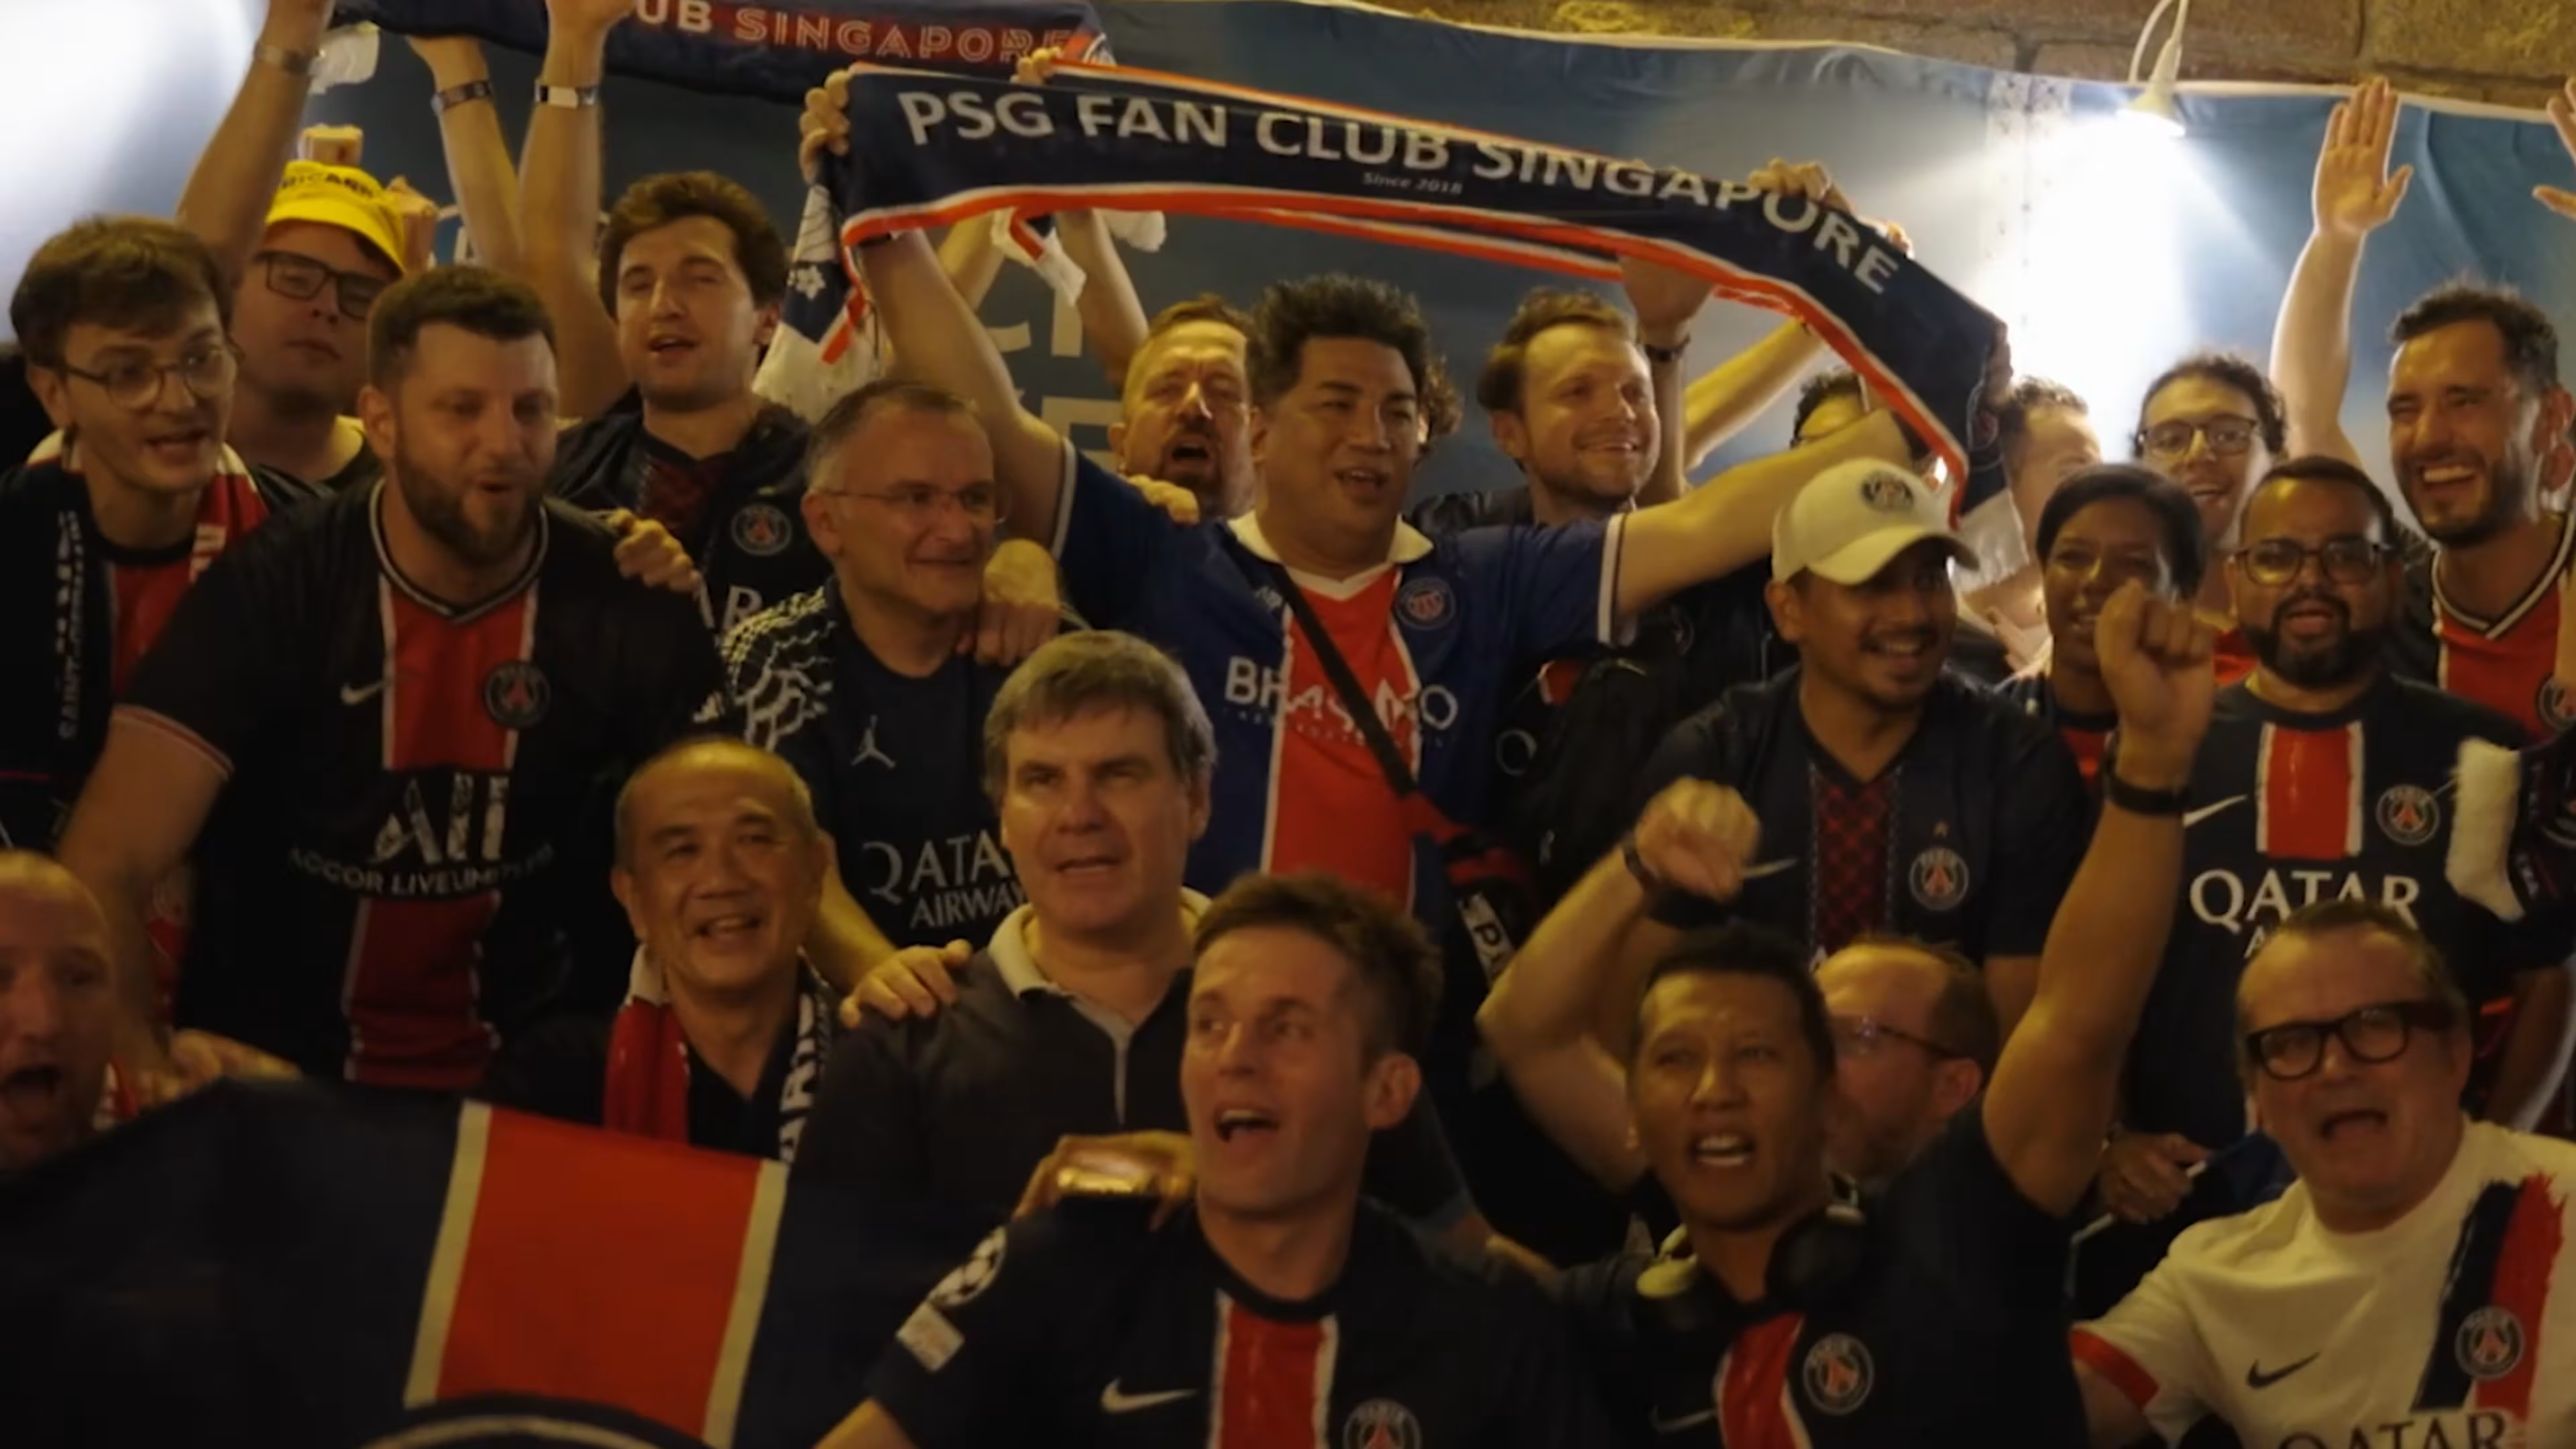


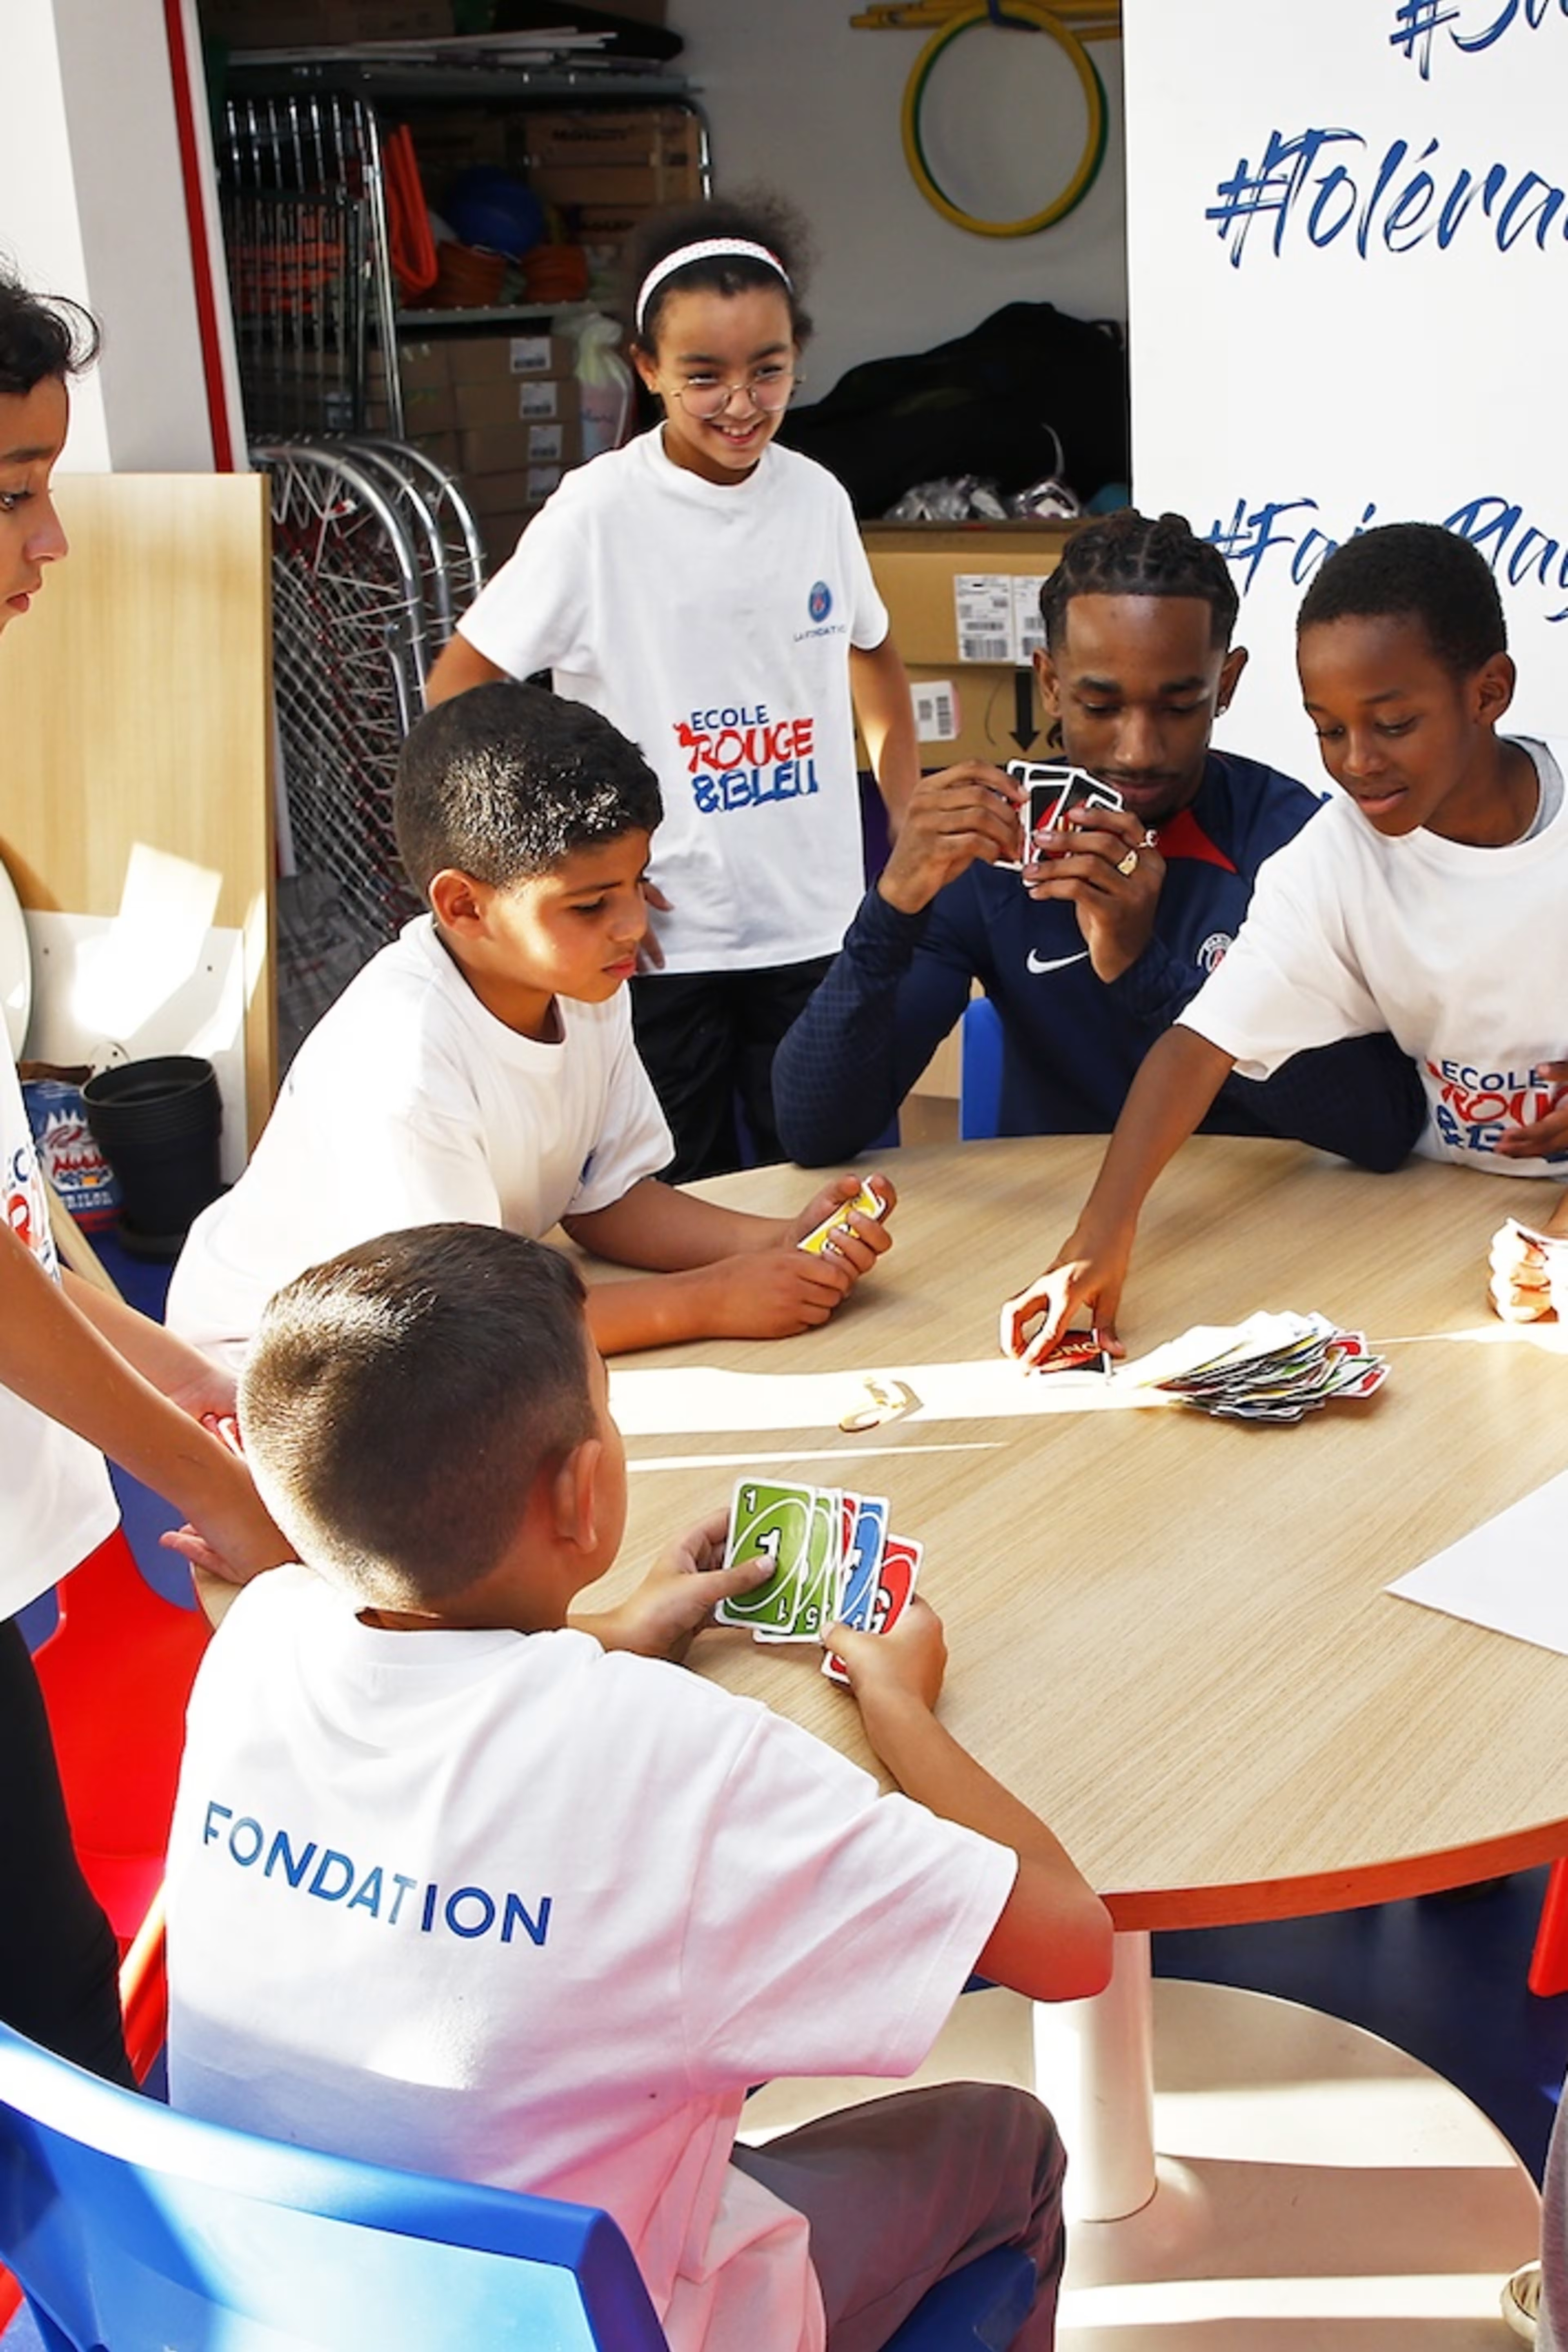
PSG for Communities carries the Club’s values into society, along with those of sport: surpassing oneself, solidarity, a love of effort, mutual support, respect, and generosity.
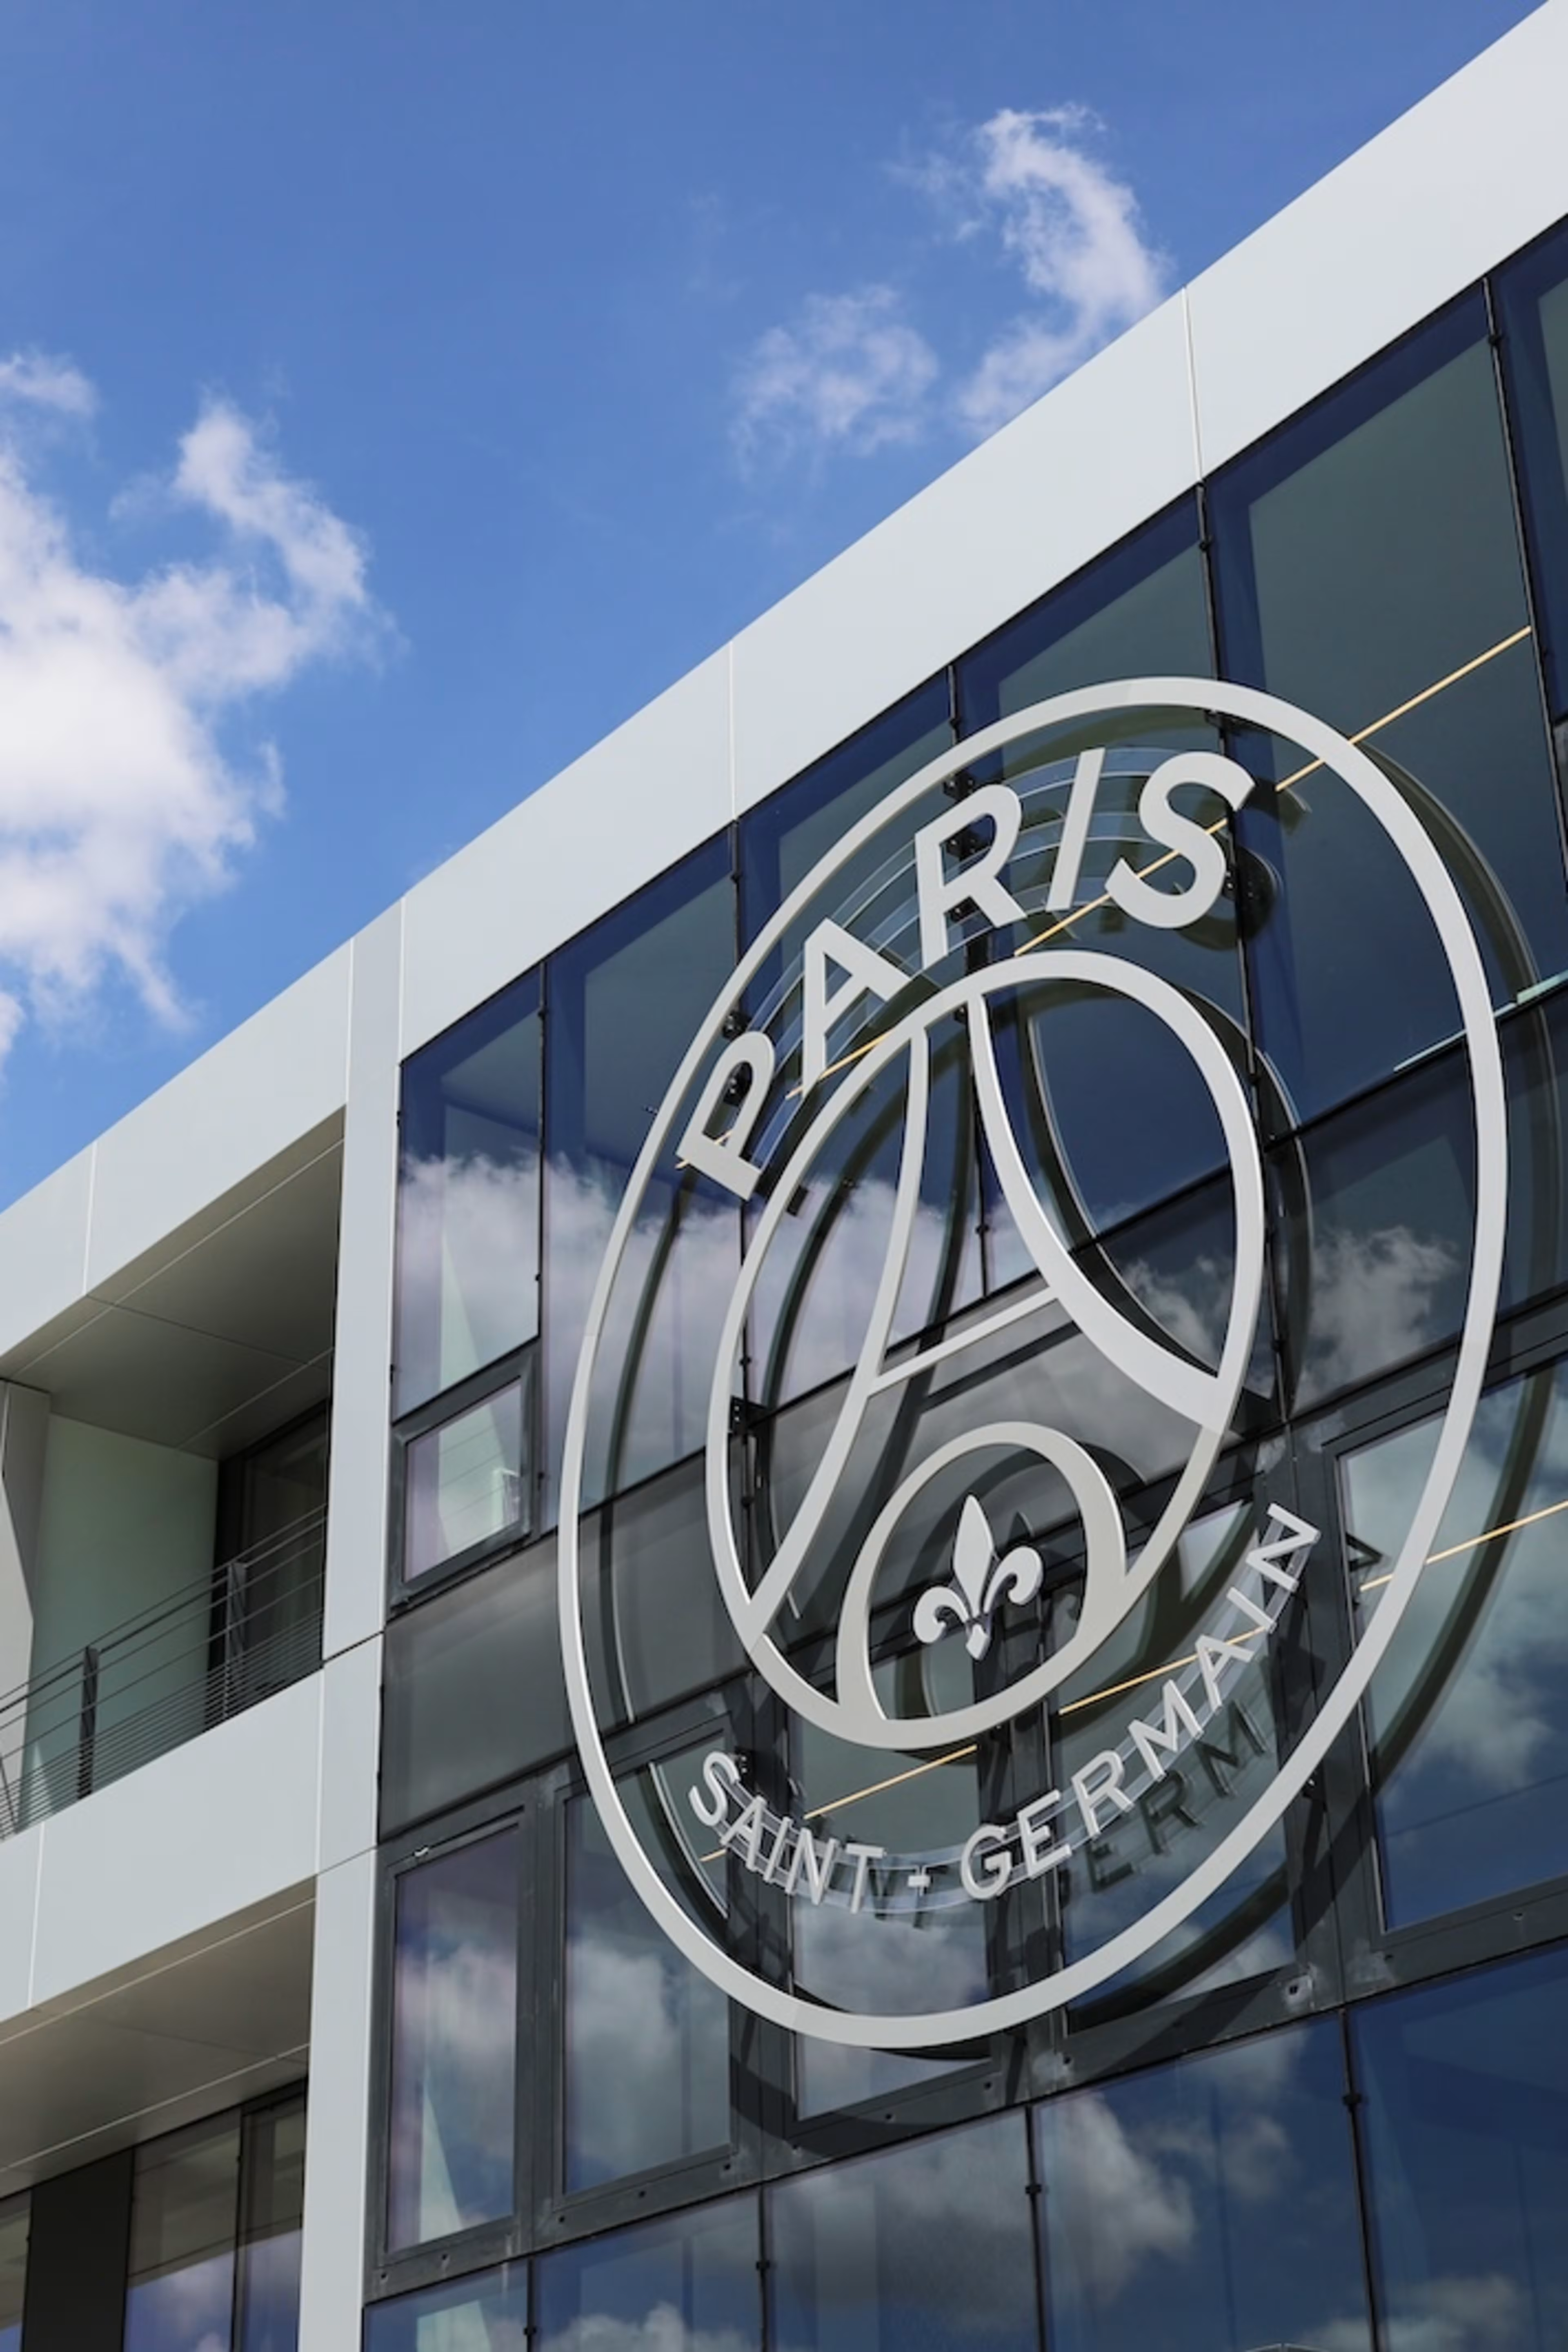
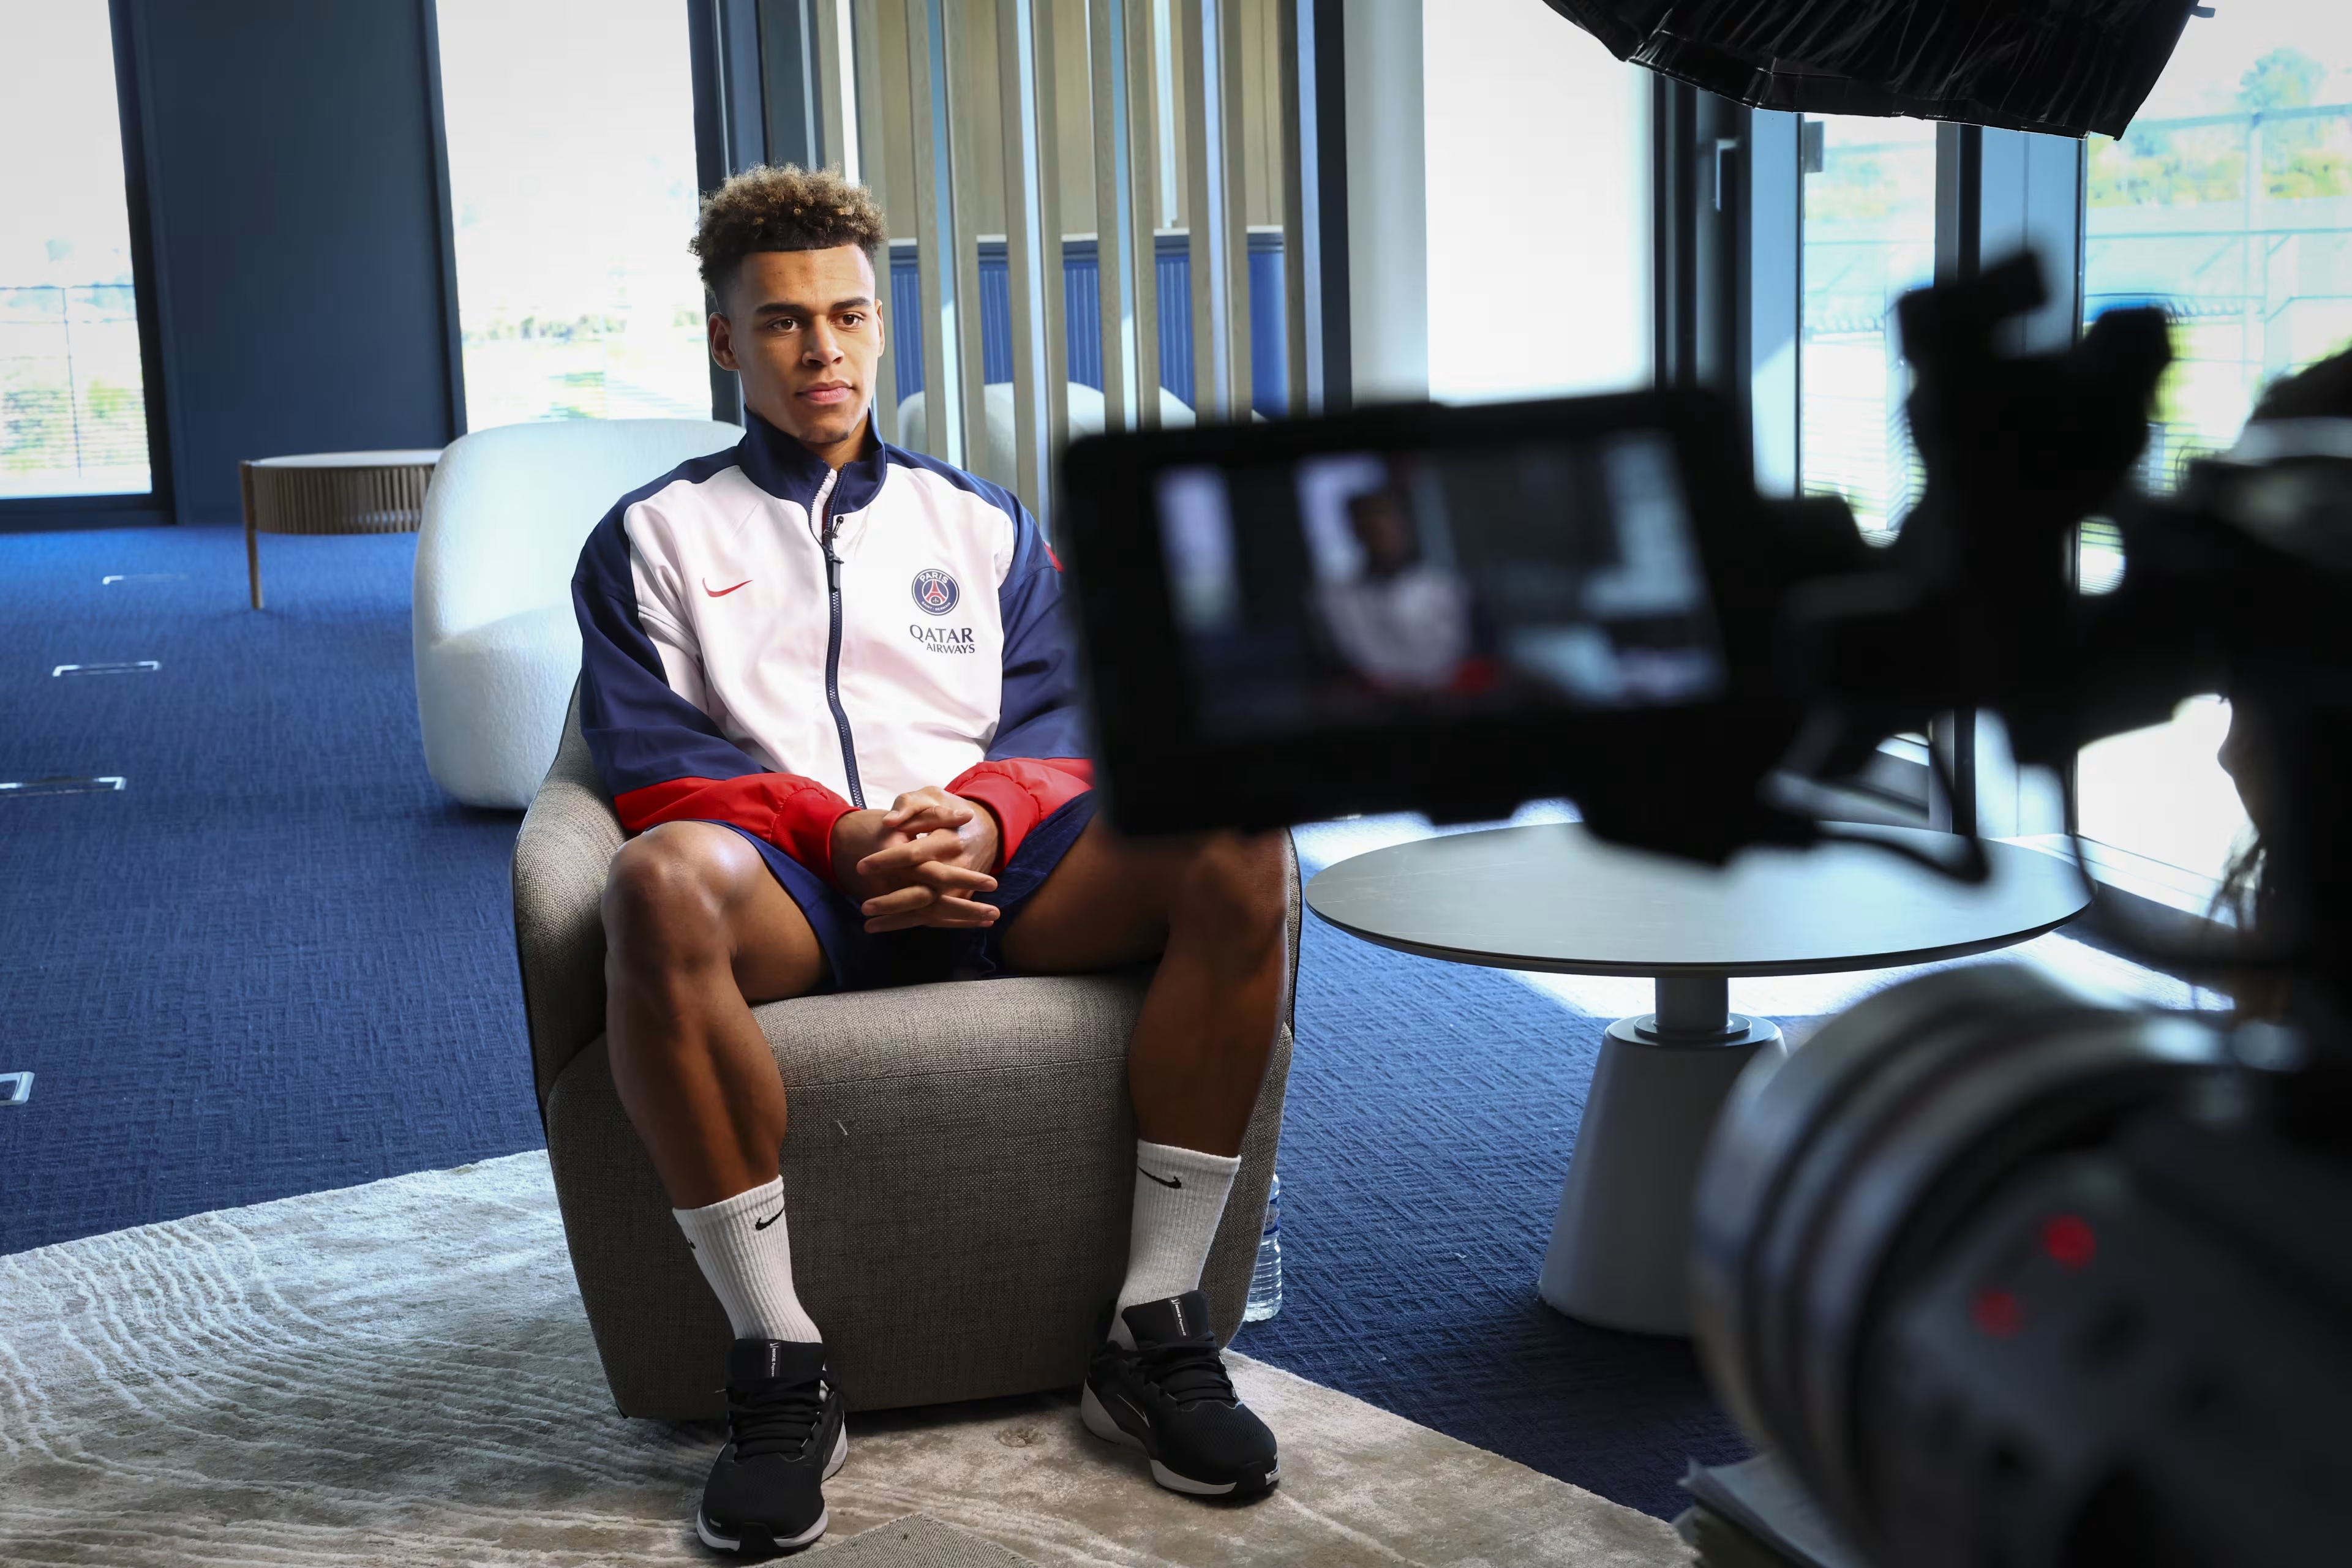
The Paris Saint-Germain Campus in Poissy reflects the institution’s growth and bold ambitions.

Stories, passion, emotions, latest news… Listen to the official audio programs of Paris Saint-Germain!

Play games, score points and win prizes.